We're open daily! View holiday hours
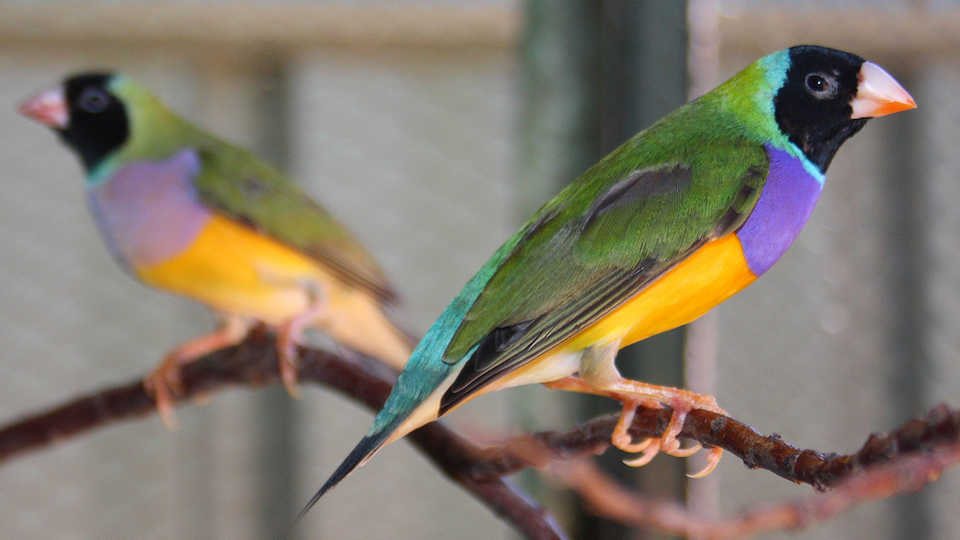
© Bill & Mark Bell
0
Gouldian finches are sometimes called "rainbow finches," and it’s easy to see why. These little birds are covered in a patchwork of brightly colored feathers, ranging from purple to blue to yellow to orange and more. Interestingly, the finches' head color is linked to their behavior. In this field trip activity, students will get experience collecting animal behavior data and using it to answer a question, as well as learning about the connections between head color and behavior in Gouldian finches.
Objectives
After this activity, students will:
- know more about how scientists study animal behavior
- have experience collecting data on animal behavior
- have experience thinking critically about data collection and analysis
- know about the link between head color and behavior in Gouldian finches
Teacher Prep
- Make a field trip reservation to the California Academy of Sciences.
- Print the Data Collection sheet, at least one copy per student.
- There are two versions, one in color and one in black and white. If you are using the black and white version, be sure to show your students color images of the finches ahead of time so they can see the difference between males and females. The National Aquarium has some good pictures: http://www.aqua.org/explore/animals/gouldian-finch
- If desired, print this article for your students to read (or have them read it online): http://www.aqob.com.au/details.php?p_id=297&listid=208&slistid=&menuid=category_id_25&submenuid
Introduction
- If desired, have your students read the article mentioned above. Alternatively, describe to students the study showing a link between head color and aggression in Gouldian finches (described in the Educator Background section).
- Give students time to discuss this phenomenon in small groups. Do they find anything interesting or surprising about this? What questions do they have about the finches?
- Have groups share out their questions with the whole class.
Activity: before your field trip
- Tell students that they will be visiting a group of Gouldian finches at the California Academy of Sciences, and they will have time to observe the birds and collect data about their behavior.
- Remind students that the studies looking at finch behavior used staged dominance contests to look at aggressive behavior. You won’t be able to do anything like that during the field trip, so you will be limited to watching the finch’s normal behavior in their exhibit habitat.
- Share this focus question for the investigation: Do the Gouldian finches at the Academy show the same patterns in behavior seen in previous studies? Are the red-headed finches more aggressive than the black-headed finches?
- Ask students to discuss this question and predict what the result might be. Give them time to talk about this in small groups. Then have groups share their ideas with the rest of the class, explaining the reasoning behind their predictions.
- Hand out the data collection sheet, one per student. [Optional: if desired you could have each student collect data two or three times in order to generate a larger data set. In this case, give each student multiple copies of the data collection sheet.]
- Explain the data collection procedure:
- Tell students they will be working in small groups to collect data on the finches during their field trip. They will be watching how the birds interact with each other, and categorizing interactions as aggressive or peaceful.
- Have students brainstorm what they think aggressive and peaceful interactions might look like.
- First, they will watch the birds for a few minutes to get familiar with how they behave (step one on the data collection sheet). They should talk with their group members about what they see.
- As a group, they will practice categorizing the behaviors that they see. Do all group members agree on which behaviors count as aggressive and which count as peaceful?
- Once the group has agreed on a few behaviors, it will be time to split up and collect data individually (step two on the data collection sheet). Each group member should observe a different individual bird in order to avoid overlapping data.
- Each student should try to watch the same bird for five minutes and tally up how many aggressive and peaceful interactions that specific bird is involved in.
- Note that we are focusing on the number of interactions rather than the length of time spent interacting. This is because the finches tend to move very fast, and many of their activities happen too quickly to time.
- Point out that since we are only counting, not timing, a long interaction still counts as just one thing, no matter how long it lasts. Only if the bird stops the behavior and then starts again would it be counted as two separate interactions.
- Tell students they will be working in small groups to collect data on the finches during their field trip. They will be watching how the birds interact with each other, and categorizing interactions as aggressive or peaceful.
- Ask students to discuss how they think this data collection will go, and what they think some potential challenges might be. Warn them that the birds move pretty quickly, so students will need to focus in order to keep track of them. If they lose track of the bird they are following, they should stop, record how long the observation was, and then start over again with a different bird. The data collection sheet has a few extra data tables in case they need to do this.
- Students may sometimes be concerned if the bird they are watching doesn’t do much—“I didn’t get any data!” However, observing that their bird doesn’t interact much with others is actually useful data, even if it looks like a blank data chart. Tell students to use the notes section of the data table to jot down what they saw even if they don’t get to record any tally marks.
Activity: during your field trip
- When you arrive at the Academy, make sure that your students know where to find the finch exhibit. It is located in the Color of Life exhibit on the east side of the first floor.
- Remind students to spend 10 – 15 minutes collecting finch data at some point during the day. (We recommend letting groups do this at different times—there is not enough space around the exhibit for a whole class to collect data at the same time. In addition, having data collected at different times of day will make for a more interesting discussion later on.)
- Enjoy your field trip!
Activity: after your field trip
- Back at school, have students get back into their small groups and combine their data, making a chart or graph to show their group totals for aggressive and peaceful interactions. Make sure they label their chart with the time of day at which the data was collected. (Depending on your students’ ability level, you can either give them guidelines for what their chart should look like or you can let them use their prior experience to figure out an effective format.)
- Have groups display their data for the whole class to see.
- Lead a class discussion about the data collection process. How did it go? What challenges did groups experience? Were all groups consistent in how they collected data? Do we feel that we can fairly combine data from different groups?
- If it seems that data collection was fairly consistent among groups, combine all the data into a single class set, and draw a chart or graph on the board to display this full set of data.
- Have another class discussion, this time focused on the data itself (both the whole-class data set and the group data sets).
- What do we notice? Are there any patterns in the data?
- Does the data answer the focus question? Why or why not?
- Are there differences among the results from different groups? Why might that be? (Occasionally this is due to different data collection approaches, but it could also show different behavior patterns at different times of day, or it could simply be random variation.)
- Ask students what conclusions they can draw based on the data, and what new questions they have about Gouldian finch behavior. If desired, have students do a written reflection about their conclusions and questions, as well as about the data collection experience.
Background for Educators
Gouldian finches (Erythrura gouldiae) are sometimes called rainbow finches, and it’s easy to see why. These little birds are covered in a patchwork of brightly colored feathers, ranging from purple to blue to yellow to orange and more. A small flock of these colorful and charismatic birds is on display in the Color of Life exhibit at the California Academy of Sciences.
One of the more interesting aspects of this patchwork rainbow is the finch’s head color. Some Gouldian finches have black heads, some have red heads, and a rare few have yellow heads. This genetic trait is linked to some interesting behaviors. For one thing, female Gouldian finches prefer to mate with males of the same head color. This is no trivial preference; offspring of pairs with the same head color are significantly more likely to survive than offspring of pairs with different head colors. Matching head color is a visible indicator of genetic compatibility.
Head color is also linked with aggression. Studies have shown that red-headed Gouldian finches are significantly more aggressive than their black or yellow-headed counterparts. These differences seem to be related to testosterone. The red-headed finches have high levels of testosterone and act aggressively toward the other birds. As a result, the red-heads are able to fight off competitors and get the best nesting sites. However, there is a downside too; high stress and hormone levels compromises the immune system, so these birds tend to live shorter lives. Meanwhile, the black-headed finches, which have lower testosterone levels, generally lose out on the good nesting sites, but tend to live longer and healthier lives than the red-heads. These black-headed finches are the most common, making up 79% of the wild population. Yellow-headed finches are extremely rare, and also extremely non-aggressive, making it difficult for them to acquire decent nesting sites.
Studies by Sarah Pryke and colleagues demonstrating this link between head color and aggression used staged “dominance contests” to collect data. For example, in some experiments two birds would be placed in a cage together with limited access to food. The interactions between the birds at the food dish were recorded, and the bird that won control of the food dish in the majority of interactions was considered to be dominant. The data showed that the red-headed birds consistently dominated the black-headed and yellow-headed birds.
For scientists who study animal behavior, a rigorous approach to data collection is necessary in order to draw conclusions like those made in this finch study. Qualitative or narrative observations are often a starting point, building familiarity with the animals and sparking questions about the observed behaviors. However, quantitative data is needed in order to answer questions and construct robust explanations of phenomena. Researchers create rigorous data collection tools to help them record quantitative observations such as the number of times a specific behavior occurred or how long a behavior lasted. The behaviors must be clearly defined to make data collection consistent; each person collecting the data must have the same understanding of what counts as each behavior type.
In this activity, students will get experience collecting animal behavior data and using it to answer a question, as well as learning about the connection between head color and behavior in Gouldian finches.
Teacher tip: Be aware that the Gouldian finches are small birds that move rather fast; it can be easy to lose track of them as they zip around the cage. Collecting usable data will take a little patience and focus.
Extension
Now that students have had an experience collecting data about animal behavior, consider building on that experience by having them design their own simple animal behavior study. Students could observe urban animals (birds at a bird feeder, insects in the school garden, pigeons on the street, seagulls on the beach, etc.), captive animals (pets at home, a fish tank at school, etc.), or even animals on a webcam (the Academy has a few: www.calacademy.org/explore-science/live-webcams-0)
- First, have students spend time observing their animal and describing the behaviors they see. What do they notice? Are there any behaviors that catch their attention? Do they see any interesting patterns?
- Next, have students develop a testable question about the animal’s behavior. Creating a viable testable question can be challenging; be sure to give students support and feedback in this process. The question should relate to something that is directly observable and quantifiable. Questions that start with “why” are rarely testable.
- Once the question is finalized, students can begin developing their data collection plan. Students should consider what kind of data would be most useful in answering their question—would it help to count how many times something happens? Measure how long the animal spends doing something? Look for a sequence of events (if X happens, what does the animal do next)? Or something else? Again, the teacher should provide support and feedback as students craft their data collection tools.
- Ideally, students should have multiple opportunities to collect data, and should be able to revise their approach based on their first couple of experiences. It is rare for a data collection tool to work perfectly the first time out; something unexpected always comes up. For example, the first few versions of our Gouldian finch tool failed because the finches move way too fast to be tracked with a stopwatch!
- When students have collected some data, they should try to determine whether or not the data answers their original question. Have students share their results either with a written conclusion or a presentation.
- Have students spend some time reflecting on their process. What challenges did they encounter? How did they solve those problems? What did it feel like to explore a question they came up with themselves? What do they think it would be like to be a scientist that studies animal behavior?
Additional Resources
If you teach genetics (or if you are just fond of Punnett’s squares), you might find the genetics of Gouldian finch color interesting. You can explore this topic on these websites:
www.finchinfo.com/genetics/lady_gouldian_finch/body_colors.php
www.finchinfo.com/genetics/lady_gouldian_finch/head_colors.php
Next Generation Science Standards
Main lesson:
Analyzing and Interpreting Data:
- Consider limitations of data analysis (e.g. measurement error, sample selection) when analyzing and interpreting data
- Compare and contrast various types of data sets to examine consistency of measurements and observations
Obtaining, Evaluating, and Communicating Information:
- Communicate scientific and/or technical information or ideas in multiple formats (including orally, graphically, textually, and mathematically).
Extension:
Asking Questions:
- Ask questions that arise from careful observation of phenomena, or unexpected results, to clarify and/or seek additional information
- Evaluate a question to determine if it is testable and relevant
- Ask questions that can be investigated within the scope of the school laboratory, research facilities, or field (e.g., outdoor environment) with available resources
Planning and Carrying Out Investigations:
- Plan and conduct an investigation individually and collaboratively to produce data to serve as the basis for evidence, and in the design decide on types, how much, and accuracy of data needed to produce reliable measurements and consider limitations on the precision of the data (e.g., number of trials, cost, risk, time), and refine the design accordingly.
- Select appropriate tools to collect, record, analyze, and evaluate data.
Model natural selection and explore the genetics behind color vision. What selective pressures affect vision?
Find detailed educator guides that will help you link our exhibits to your curriculum.
Appropriate for: 9th Grade - 12th Grade
Standards for: 9th Grade, 10th Grade, 11th Grade, 12th Grade
Prep Time: 30 minutes
Activity Time: 120 minutes
Subjects: Analyzing & Interpreting Data, Planning Investigations