Habitat Earth in the Classroom
Browse a rich array of educational resources from the award-winning show, Habitat Earth.
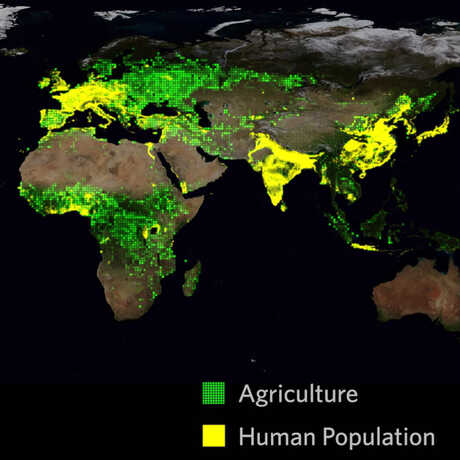
Trace patterns of agricultural expansion through space and time, especially as they relate to climate and geography. How are patterns of human settlement and human population growth linked? Do you see evidence for how agriculture spread and retreated from different places based on historical events?
How are patterns of human settlement and human population growth linked to how land has been used for agriculture?
After this activity, students will be able to
Small group task: using reliable information sources of your choice and integrating the selected temporal /geographic section of the clip, create a presentation tracing patterns of agricultural expansion and population growth through space and time, constructing explanations for how these patterns relate to climate and geography. Your presentation must:
Following the small group presentations, pull together the class to discuss an overarching trend, or stimulate further discovery. For example:
Science teachers may be interested in having students brainstorm what types of additional questions could be answered directly using the data from this clip. Topics might include:
Educators interested in maps created via large-scale data sets can dive deeply into the ways humans have transformed the biosphere by visualizing the Anthromes 2 Maps in either Google Maps or Google Earth.
How Did Human Civilization Spread? depicts the growth and development of population centers in North America during the time period 1200 CE and 1996 CE. These data are contrasted with the geographic range and expansion of agriculture across the globe during the same time period. These data have been compiled from an extensive data set, simplifying the data for a global visualization by using larger grid blocks whose brightness indicates the intensity of land use or population density. Note that the green agriculture grid blocks include both agriculturally developed areas for crops and pasture used for animal grazing.
For additional background, please see:
Feeding 9 Billion
This resource is National Geographic’s ongoing series about food and agriculture. The article above talks about some of the design solutions and policy changes we will need to implement to sustainability support the Earth’s burgeoning population.
Disciplinary Core Ideas (6-8)
Science and Engineering Practices (6-8)
Cross-Cutting Concepts (6-8)
The following list include potential topics listed in the History and Social Studies content standards for which the above visualization may serve useful, even as a “hook” to capture students attention for a new unit of study.
Grade 6
Paleolithic Era to Agricultural Revolution
Grade 7
Medieval and Early Modern Times (500-1789 AD)
Grade 8
United States: Early Growth: 1750s-1850s
Grade 9-10
Modern World History: late 1700s to present
Grade 11
United States: 1900s
1945, including the computer revolution, changes in communication, advances in medicine, and improvements in agricultural technology.
Integration of Knowledge and Ideas:
CCSS.ELA-LITERACY.RI.6.7
Integrate information presented in different media or formats (e.g., visually, quantitatively) as well as in words to develop a coherent understanding of a topic or issue.
CCSS.ELA-LITERACY.RH.6-8.7
Integrate visual information (e.g., in charts, graphs, photographs, videos, or maps) with other information in print and digital texts.
Presentation of Knowledge and Ideas:
CCSS.ELA-LITERACY.SL.6.4
Present claims and findings, sequencing ideas logically and using pertinent descriptions, facts, and details to accentuate main ideas or themes; use appropriate eye contact, adequate volume, and clear pronunciation.
CCSS.ELA-LITERACY.SL.6.5
Include multimedia components (e.g., graphics, images, music, sound) and visual displays in presentations to clarify information.
Gridded Population
Total, Urban and Rural Counts, Densities and Areas 10,000 B.C. – 2005 A.D.: Klein Goldewijk et al. (2010), Klein Goldewijk et al. (2011)
Gridded Cropland and Pasture Land Use
10,000 B.C. – 2005 A.D.: Klein Goldewijk et al. (2010), Klein Goldewijk et al (2011)
Browse a rich array of educational resources from the award-winning show, Habitat Earth.