We're open daily! View holiday hours
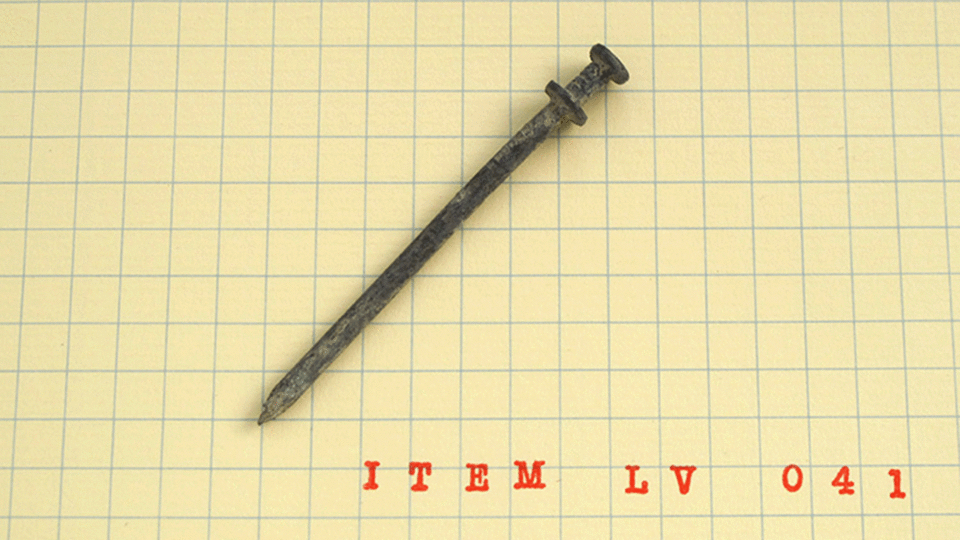
Antarctic Item 041 is a 2.5-inch discarded rivet that I found at McMurdo Station. Although it lacks the bend of my previously posted wire pieces, I'll make the case that this too resembles a line graph — specifically the Keeling Curve, which is more of a steep, steady incline than a curve. 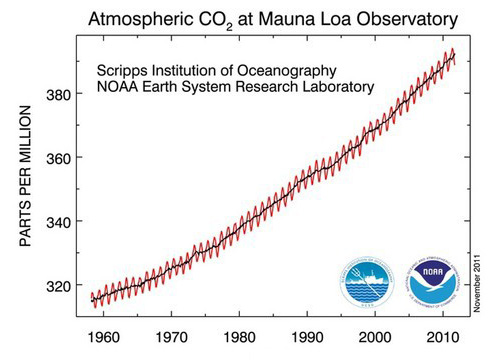 The Keeling Curve is a graph that plots the ongoing change in concentration of carbon dioxide in Earth's atmosphere. Recorded from atop Hawaii’s Mauna Loa since 1958, it is the longest-running such measurement in the world. The Keeling Curve shows that atmospheric carbon dioxide levels are increasing, and doing so at a faster rate each year. In May 2013, CO2 concentrations in the global atmosphere surpassed 400 parts per million (ppm) for the first time in human history.